Logs, metrics and debugging#
Every run tells you what it is doing in four places: its state and reason (one sentence), its workers' logs, their metrics (GPU, CPU, memory, network), and its history (every state change, also published as events). This page shows how to read each from the console, the CLI and the API, and ends with a step-by-step way to debug a run that failed or never started.
Logs#
A worker's log is its container's standard output and standard error, kept on the machine that runs it. Astraeus fetches it from the machine on request, over the machine's own outbound connection; logs are not kept anywhere but on the machine.
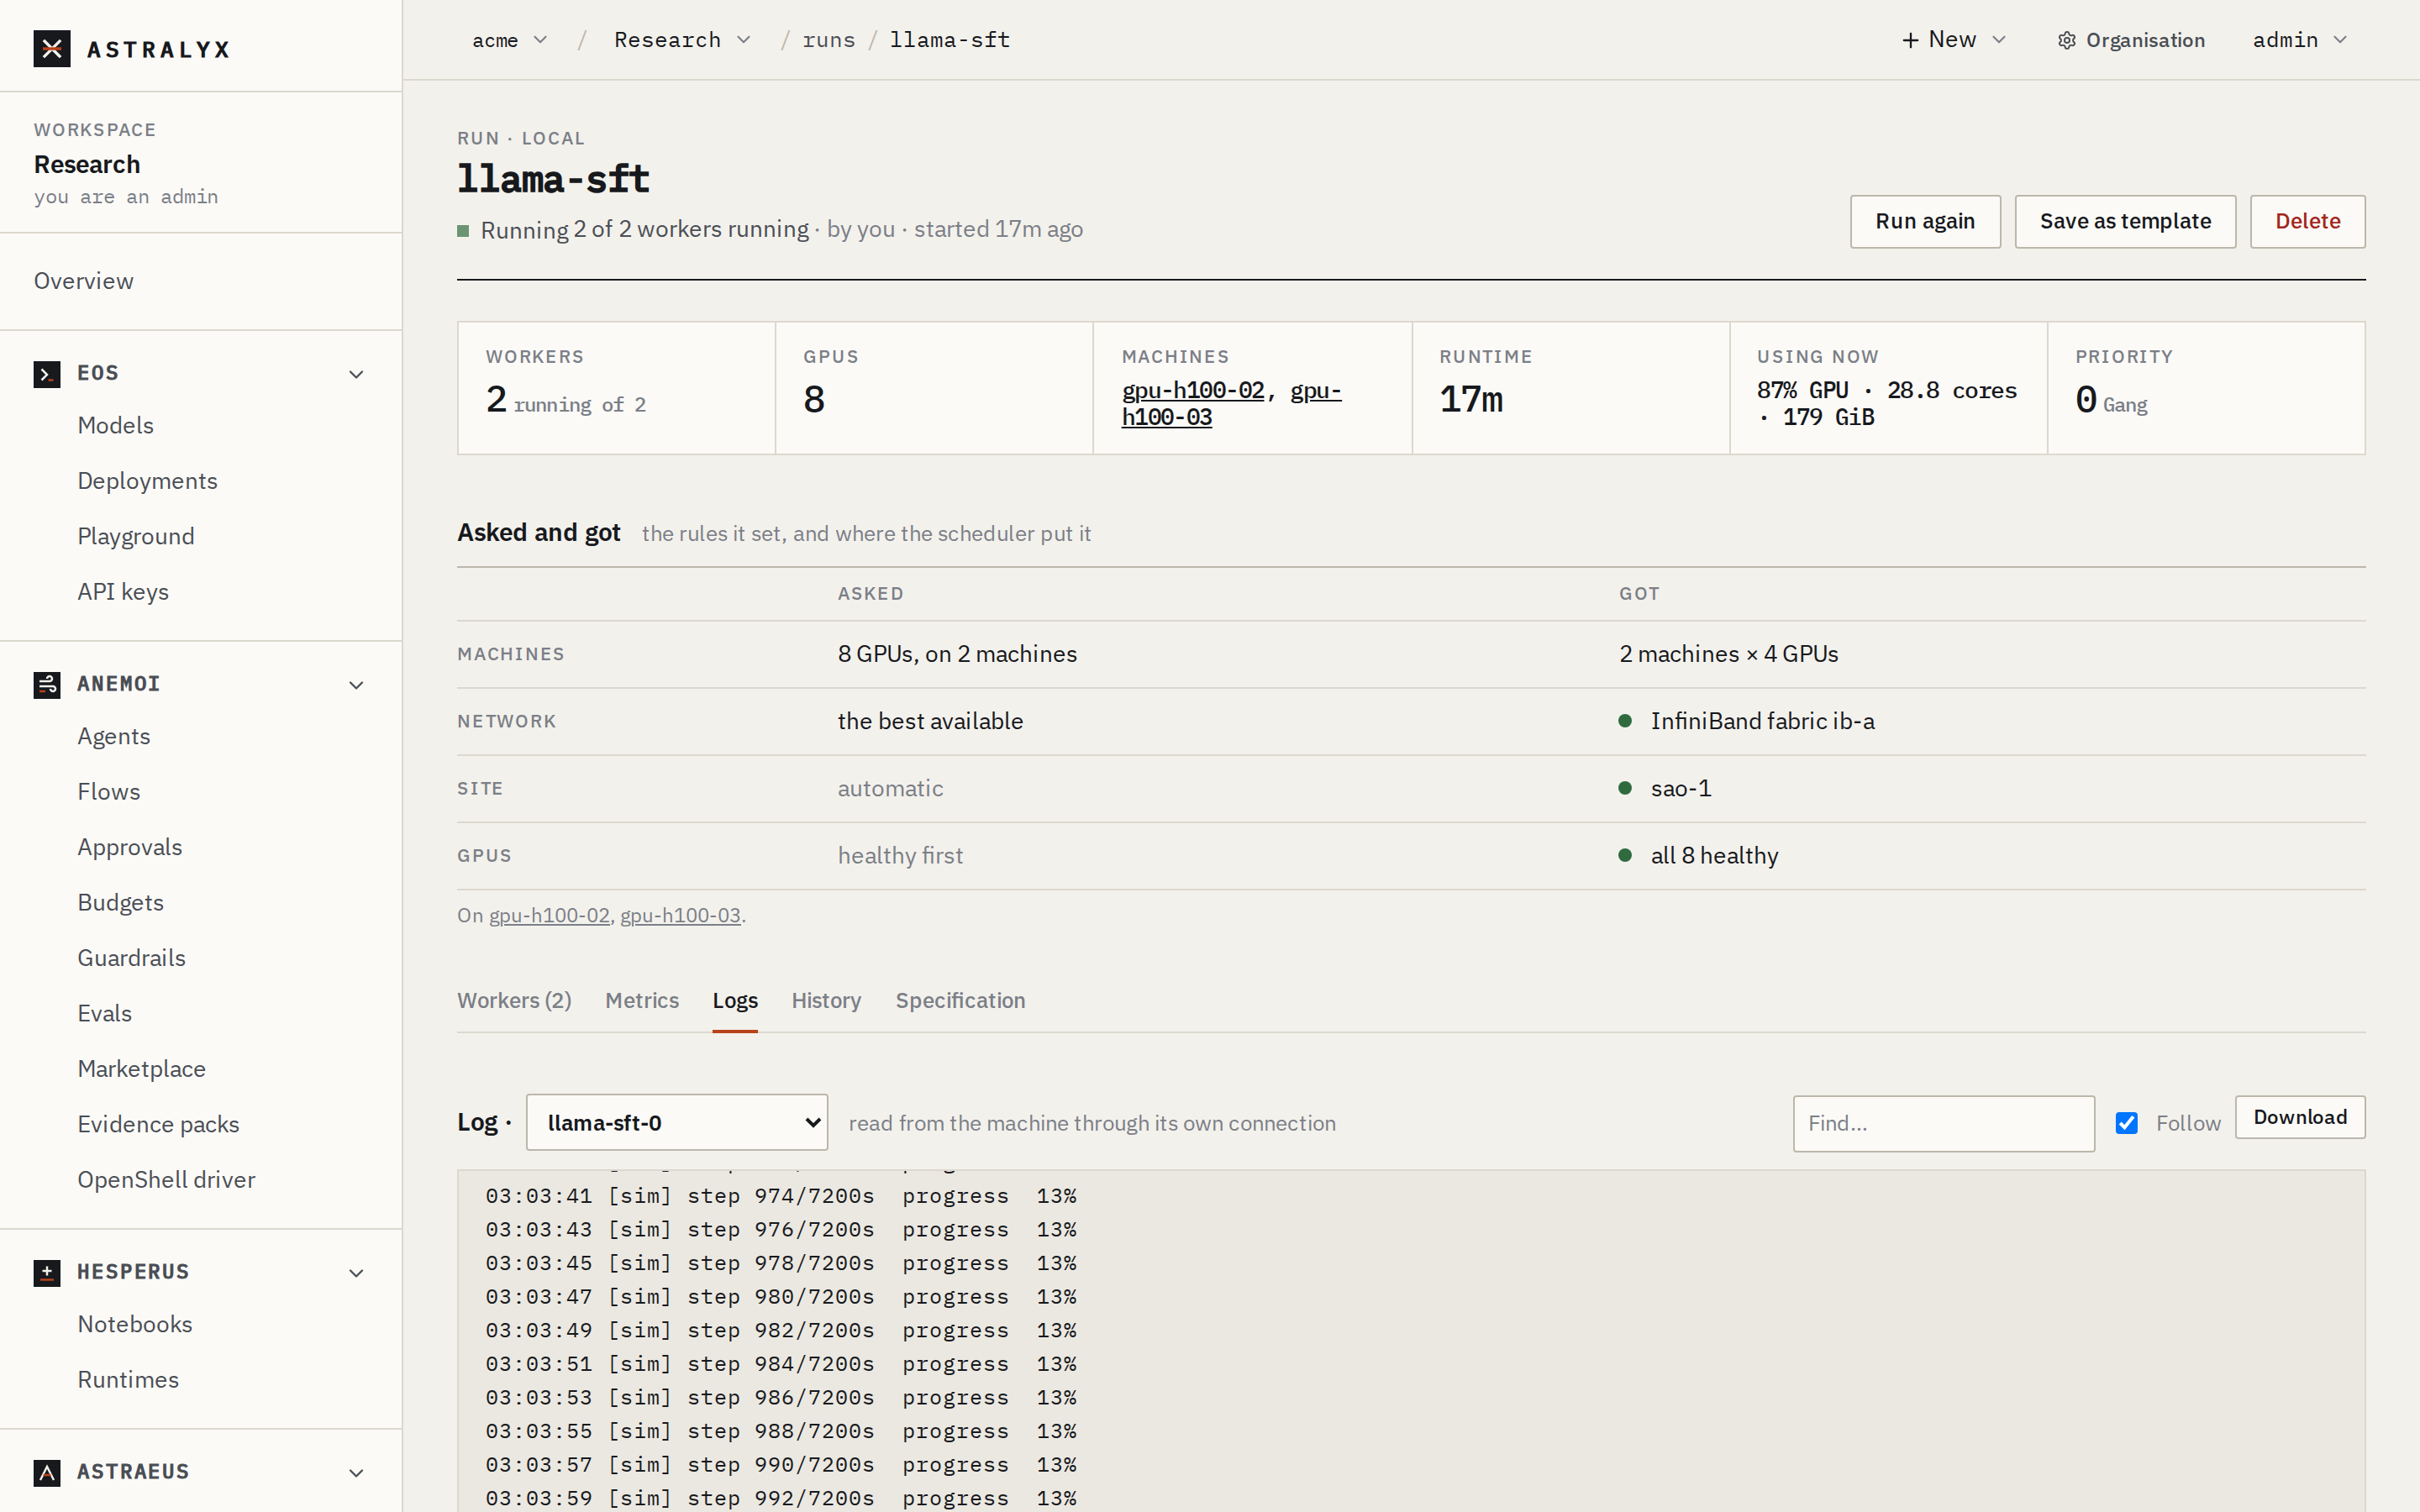
- On a run's page, the Logs tab shows one worker's log, the last 5 000 lines. Pick the worker in the Log · selector, or select Log on a row of the Workers tab.
- Follow (on by default) refreshes it every 4 seconds and keeps the end in view.
- Find… filters lines. When lines look like errors (
error,exception,traceback,NCCL WARN,CUDA error,killed), the note says how many, and Errors only keeps the lines containingerror. - Download saves what is shown as
<worker>.log. - A worker's own page has a Log tab too.
astra astraeus logs takes a run (its first worker) or a worker (<run>-<rank>); -f follows until the worker ends and exits non-zero if it did not complete:
$ curl -sS "$API/tasks/llama-sft-1/logs?tail=200" -H "Authorization: Bearer $ASTRA_TOKEN" | jq -r .logs
| Parameter | Default | Description |
|---|---|---|
tail |
1000 |
Lines from the end, at most 10 000. |
The answer is {"task_name", "logs"}, with "archived": true when it comes from a container that no longer exists (below). The text is cut to its last 900 KiB. A worker not yet placed answers 409 TASK_NOT_PLACED; a machine that does not answer, 400 TASK_LOG_UNAVAILABLE or a timeout.
Logs of earlier attempts#
A restart starts a new container. When a worker's container is removed from a machine (the worker restarts elsewhere, or is deleted), the machine keeps its last 1 000 lines and serves them while the worker has no container there. A new container for the same worker on the same machine replaces what is shown.
What always survives a failure is the last failure snapshot: the reason, the exit code, the time, and the last 50 lines of output (at most 16 KiB). The console shows it in the failure panel of the run and of the worker; the API has it as last_failure:
$ curl -sS "$API/tasks/llama-sft-1" -H "Authorization: Bearer $ASTRA_TOKEN" | jq .last_failure
{
  "reason": "OOMKilled: the container exceeded its memory limit",
  "failed_at": "2026-10-01T03:12:44.118202+00:00",
  "exit_code": 137,
  "log_tail": "…\n[rank1]: step 4410 loss 1.402\n"
}
Logs go with the run
Deleting a run deletes its workers and their logs. A machine removed from the cluster takes its workers' logs with it. To keep output, write it to a drive or download it first.
State, workers and progress#
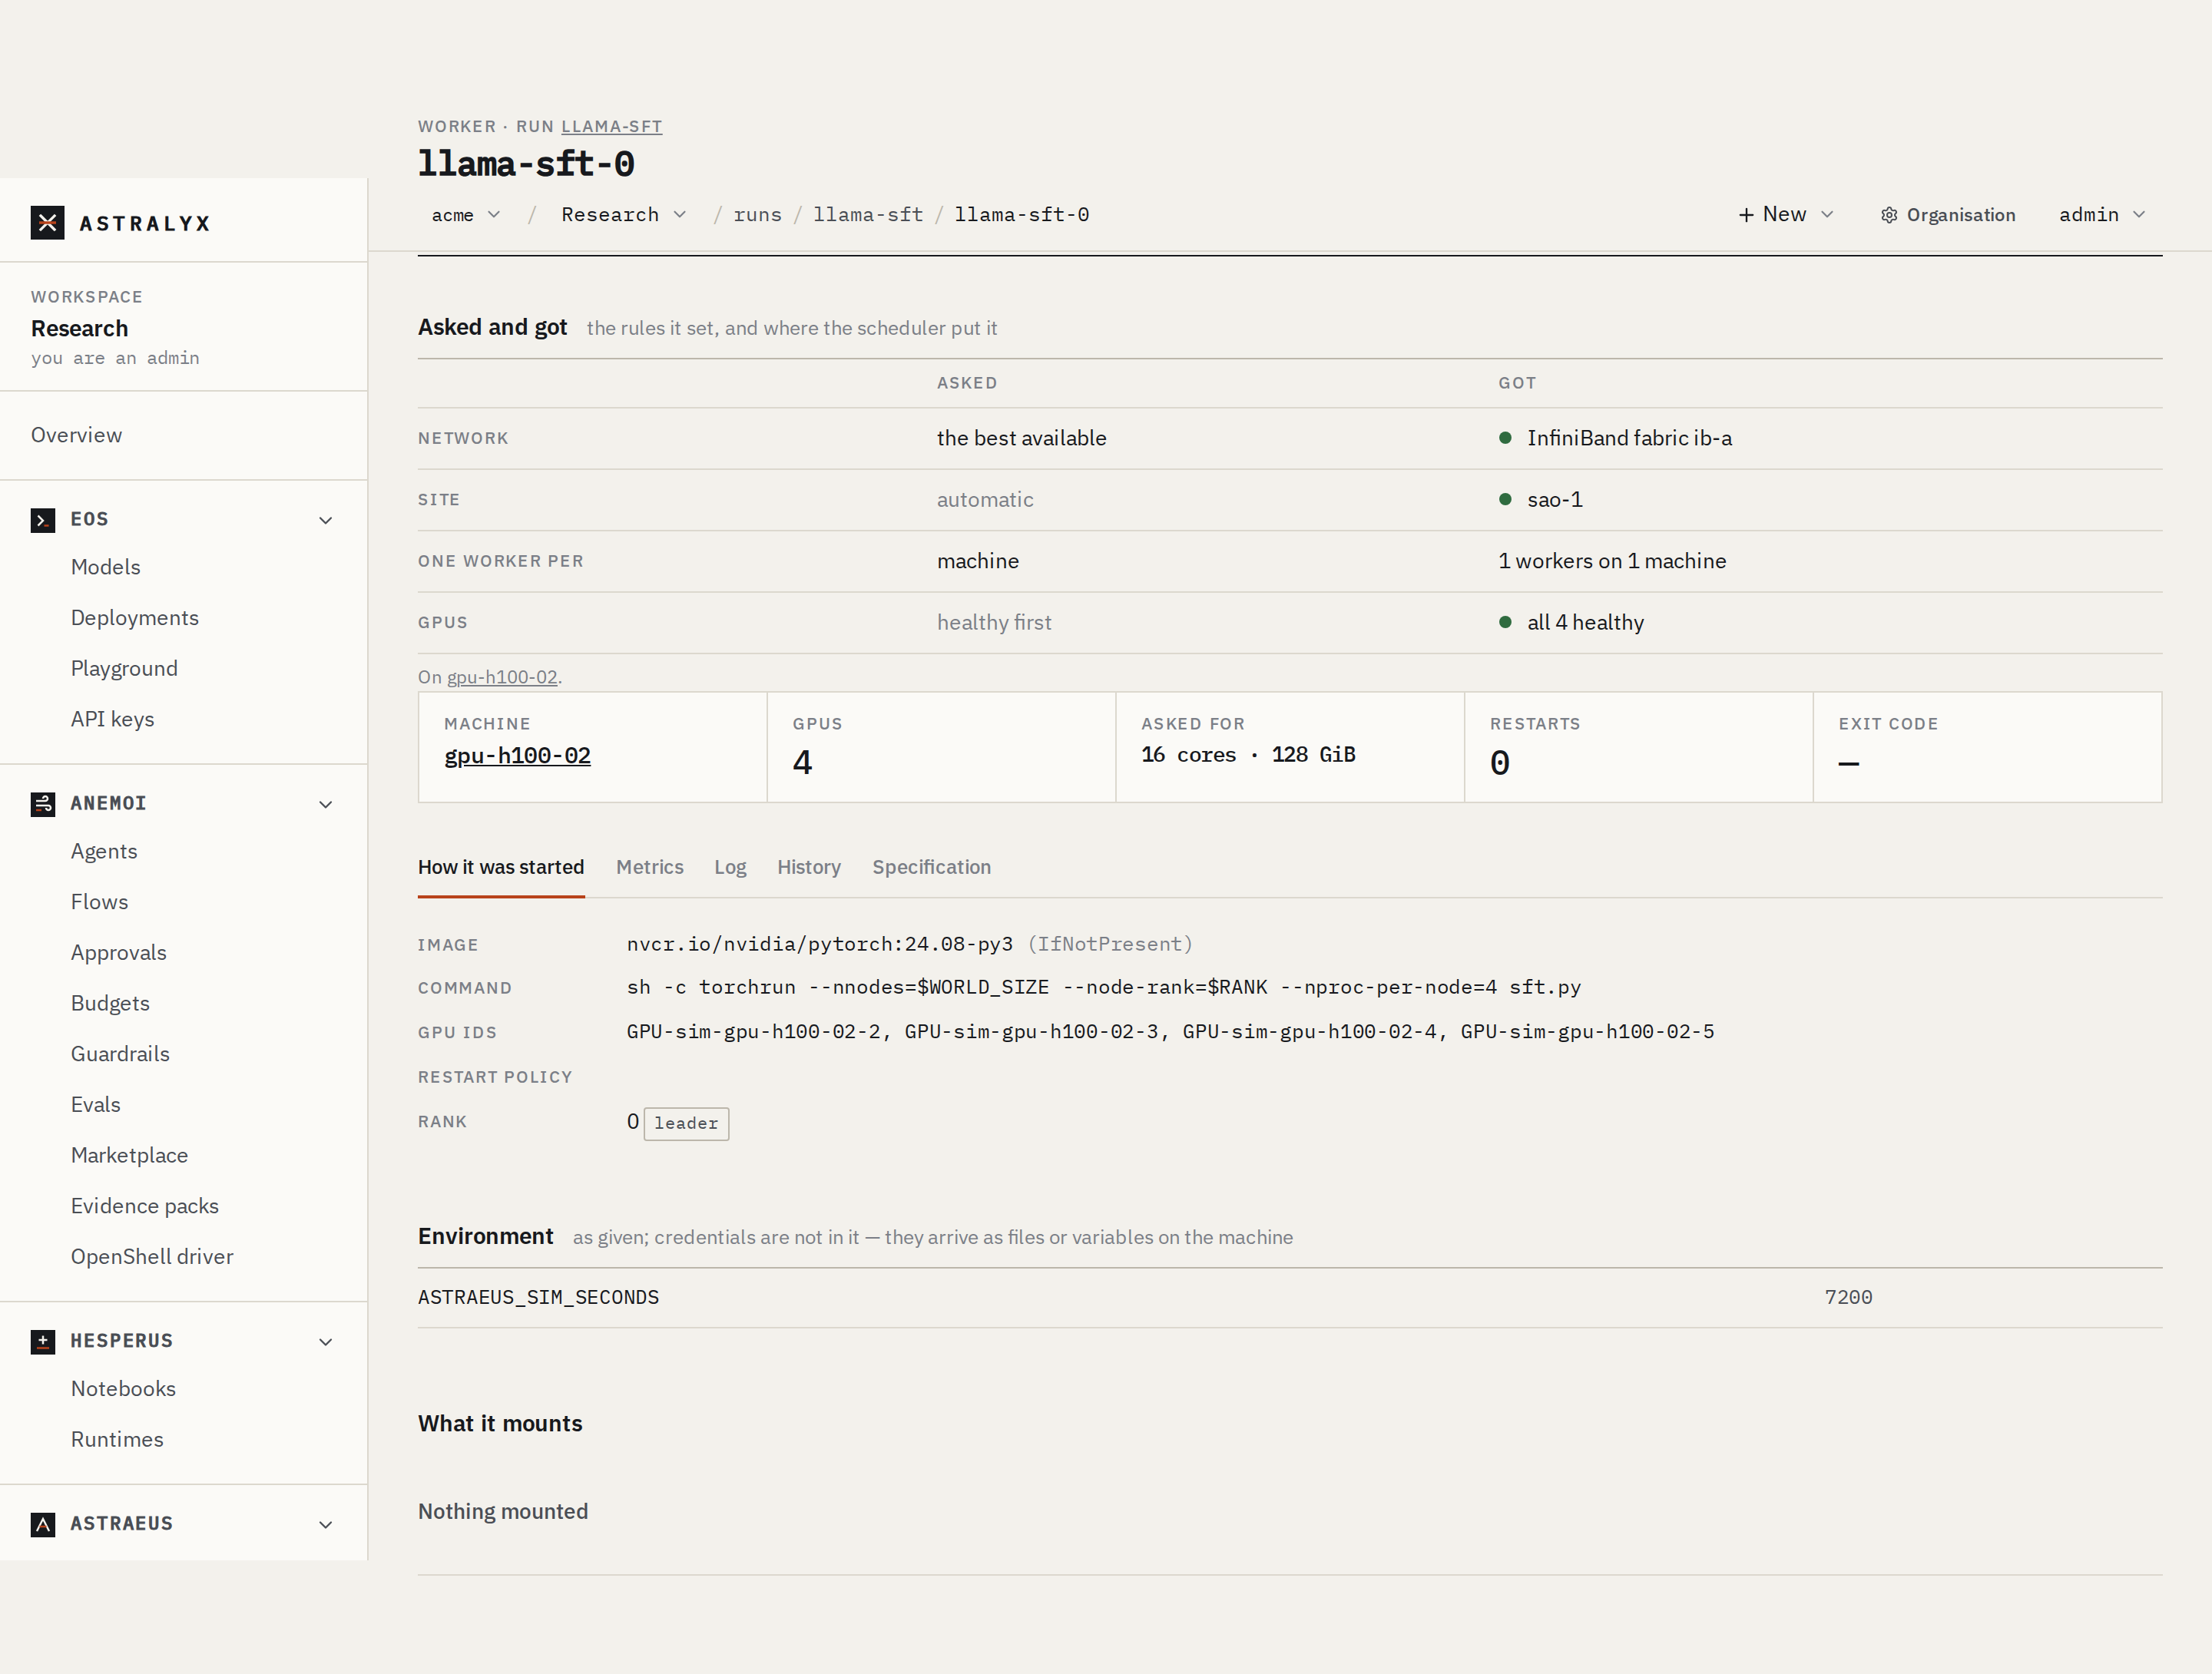
The run's page leads with its state and a sentence (Waiting for room for all its workers at once, It ran out of memory), who started it and when. The readout shows Workers (running of total), GPUs, Machines, Time left (with a time limit) or Runtime, Using now (GPU %, cores, memory) and Priority with how it starts and fails. The Workers tab lists each worker's State, What it means, Machine, GPUs, Exit code and restarts.
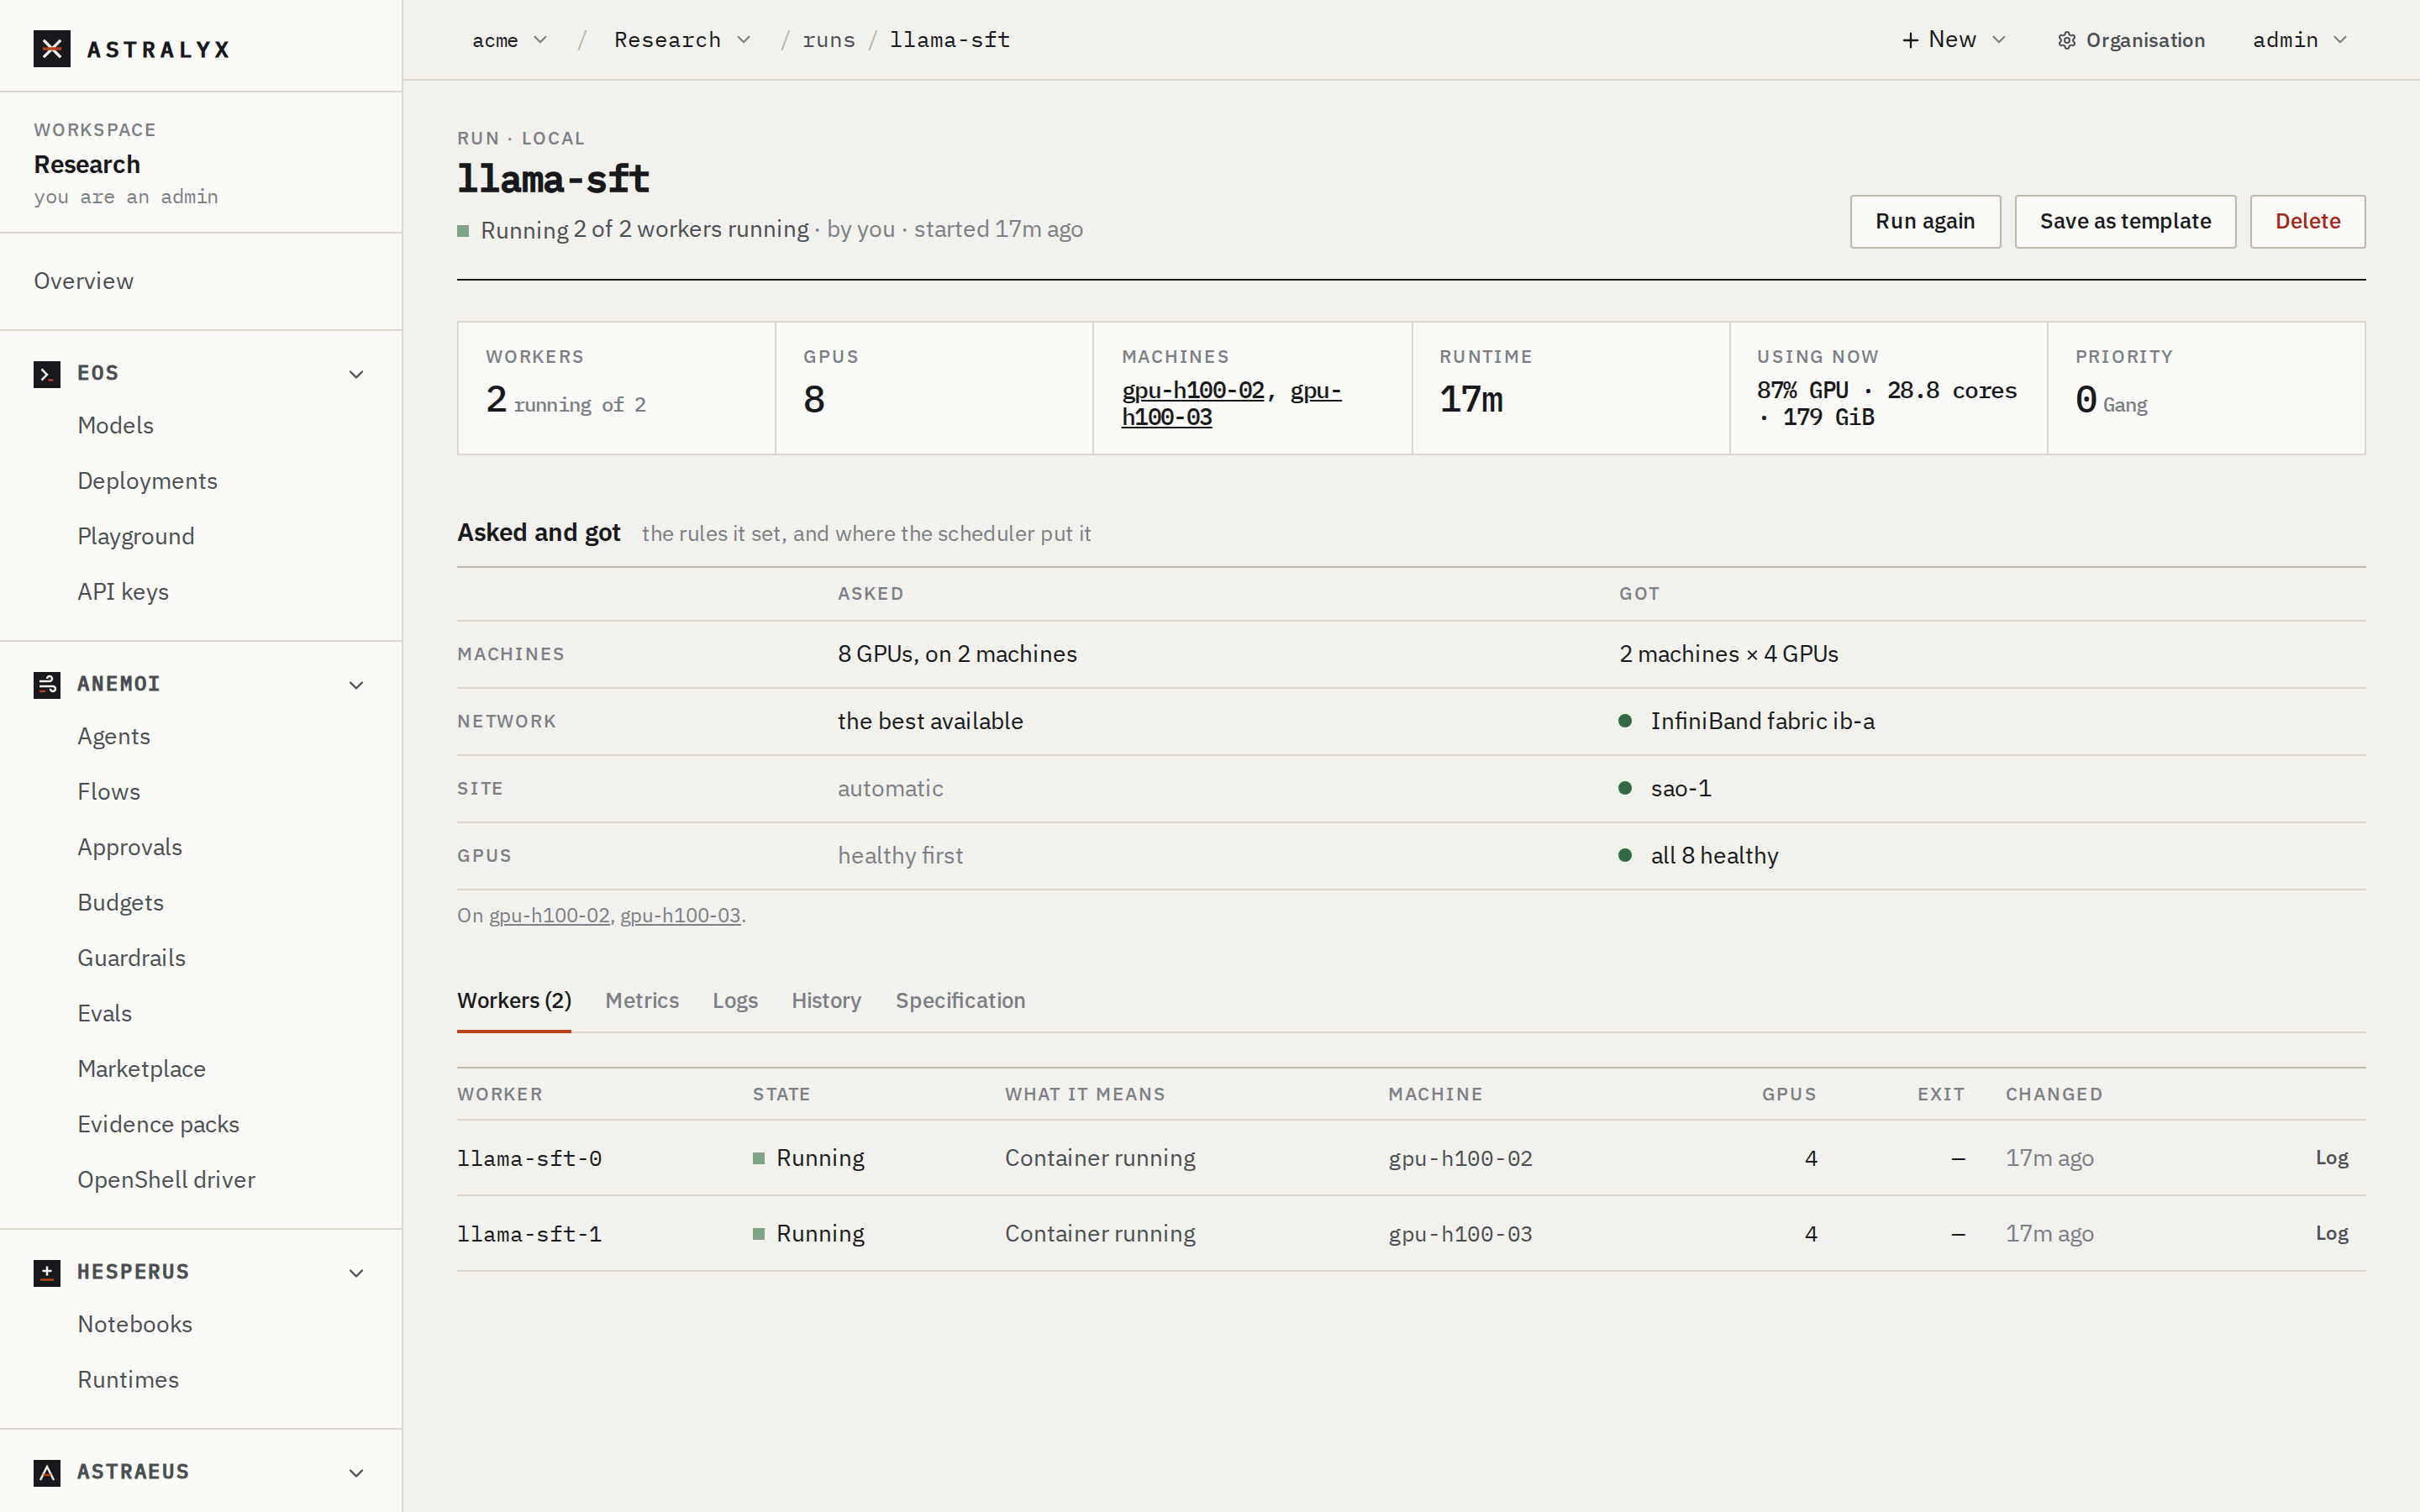
A worker's page (/o/<org>/w/<workspace>/workers/<cluster>/<worker>) shows its machine, GPU ids, what it asked for, its restarts and exit code, and How it was started: image, command, user, GPU ids, restart policy, time limit, rank, environment and mounts.
$ astra astraeus status llama-sft
llama-sft: Running — 2 of 2 workers running
  llama-sft-0  Running  gpu-07  Container running
  llama-sft-1  Running  gpu-08  Container running
$ astra astraeus workers llama-sft
WORKER                        RANK   STATE       MACHINE               REASON
llama-sft-0                   0      Running     gpu-07                Container running
llama-sft-1                   1      Running     gpu-08                Container running
astra astraeus runs lists the workspace's runs that have not ended; -a adds ended and deleted ones.
GET $API/jobs/<run> returns the run with status, history, task_counts and task_names; GET $API/tasks?job=<run> returns its workers with status, exit_code, restarts, restart_at, last_failure, placement and metrics.
Metrics#
Each machine samples its workers and sends the samples to Astraeus:
| Metric | Unit | What |
|---|---|---|
task_cpu_usage_cores |
cores | CPU in use. |
task_memory_used_bytes |
bytes | Memory charged to the worker. |
task_memory_limit_bytes |
bytes | Its memory limit. |
task_oom_kills_total |
count | Processes killed for memory. |
task_network_receive_bytes_total, task_network_transmit_bytes_total |
bytes | Network traffic. |
task_gpu_utilization_ratio |
0–1 | Per GPU (gpu label). |
task_gpu_memory_used_bytes |
bytes | Per GPU. |
task_gpu_sm_active_ratio, task_gpu_tensor_active_ratio, task_gpu_dram_active_ratio |
0–1 | SM, tensor core and memory-bandwidth activity; NVIDIA Hopper GPUs or later. |
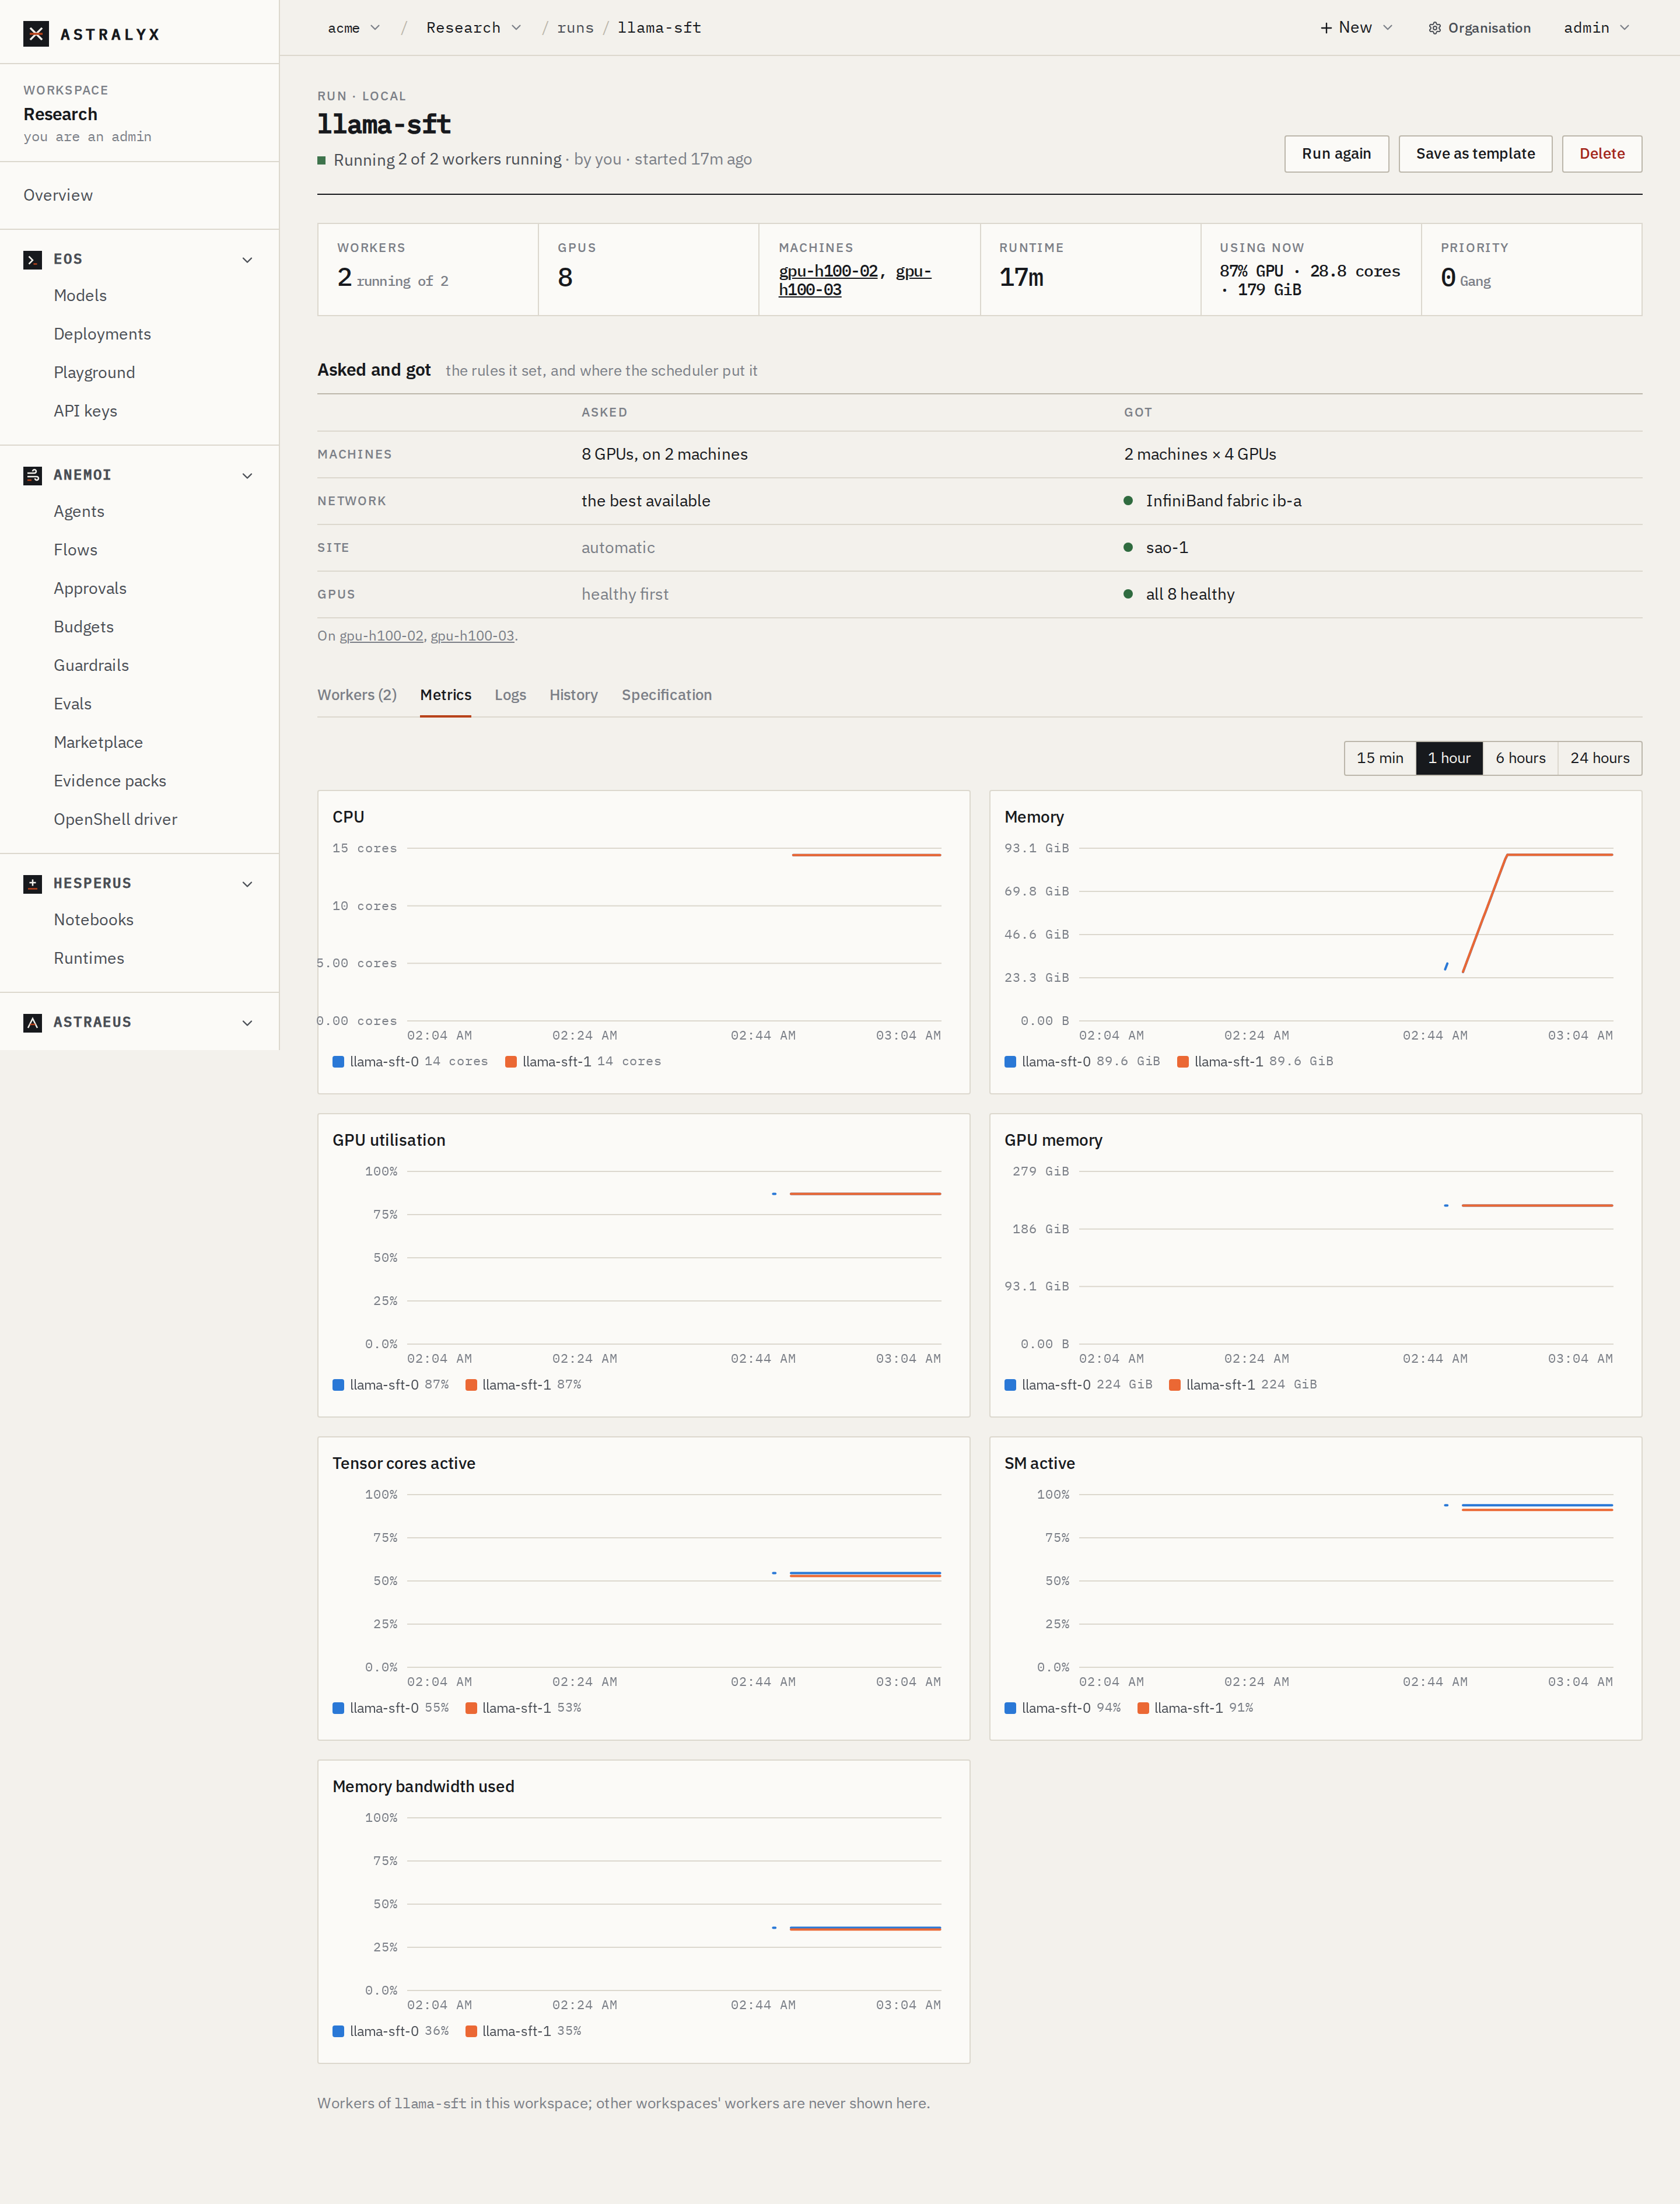
- The run's Metrics tab charts CPU, memory, GPU utilisation, GPU memory, tensor cores, SM activity and memory bandwidth, per worker.
- A worker's Metrics tab charts CPU, memory, GPU utilisation and memory per GPU, tensor cores and network received, over a range you pick.
astra astraeus gpus lists every GPU the workspace can see: machine and index, model, utilisation, health and which run holds it.
$ curl -sS -G "$API/metrics/range" -H "Authorization: Bearer $ASTRA_TOKEN" \
    --data-urlencode metric=task_gpu_utilization_ratio \
    --data-urlencode match=task:llama-sft-0 \
    --data-urlencode by=gpu --data-urlencode agg=max \
    --data-urlencode start=$(( $(date +%s) - 3600 )) | jq '.series[0]'
| Parameter | Default | Description |
|---|---|---|
metric |
required | A metric name above. |
match |
— | label:value, repeatable: task:<worker>, gpu:0. |
by |
one series | Labels to keep, comma-separated; the rest are combined. |
agg |
avg |
sum, avg, max or min. |
rate |
false |
Per-second rate of a counter (…_total). |
start, end, step |
the last hour, now, automatic | Unix seconds. |
The answer is {metric, kind, unit, start, end, step, series: [{labels, points: [[ms, value], …]}]}. In a workspace, only its own workers' series are returned.
History and events#
Every state change of a run and of each worker is recorded with its reason and time.
The run's History tab lists the run's events (state changes, quota, deletions); a worker's History tab lists its own transitions, newest first. The workspace's Events page shows every event of the workspace.
astra does not print history. Use the API.
$ curl -sS "$API/jobs/llama-sft" -H "Authorization: Bearer $ASTRA_TOKEN" | jq -c '.history[] | [.transition_at, .state, .reason]'
["2026-10-01T01:02:11.402117Z","Pending","Run created"]
["2026-10-01T01:02:12.009311Z","Starting","Starting together: 0 of 2 ready"]
["2026-10-01T01:04:40.771026Z","Running","2 of 2 workers running"]
The workspace's events, across clusters: GET https://console.astralyx.cloud/api/v1/orgs/<org>/workspaces/<workspace>/events?name=<run>&limit=50.
Events can also be streamed to your own systems; see Events and audit.
Debug a failed run, step by step#
- Read the run's reason. It names the worker, the machine and why:
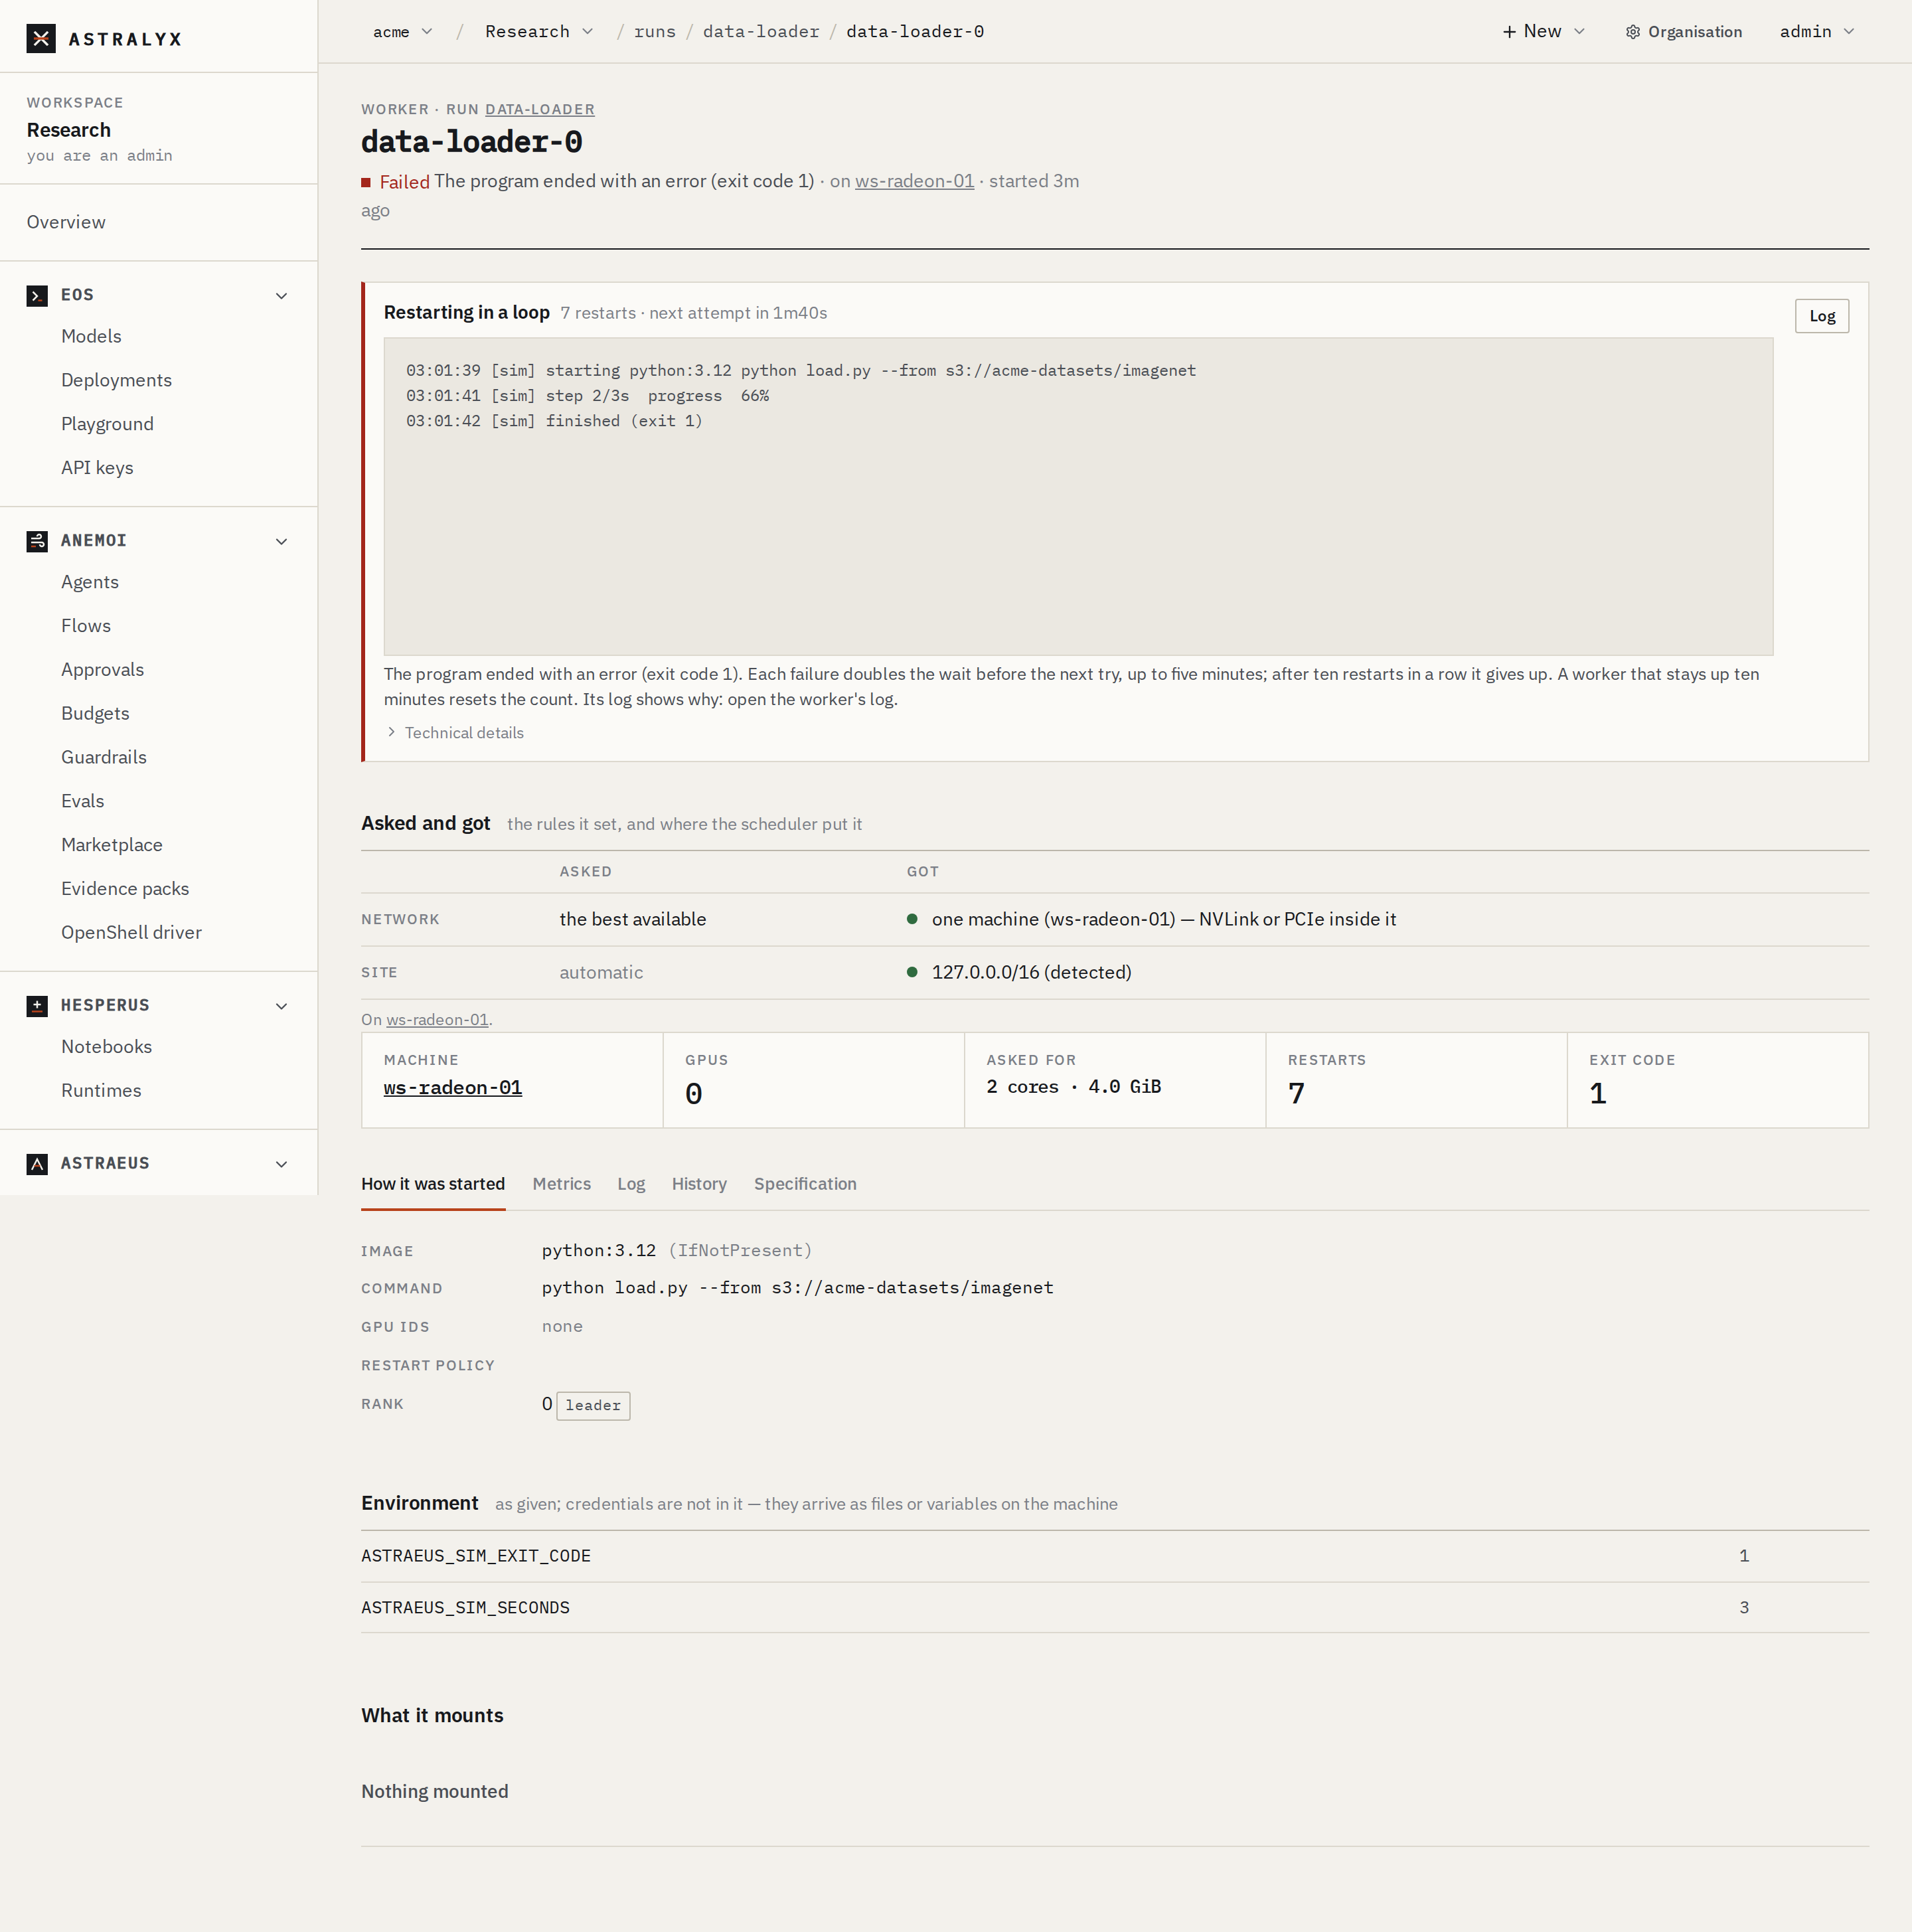
Worker llama-sft-1 failed on gpu-08: Exited with code 1; the gang does not run without it. In the console the failure panel turns it into advice and offers Its log. -
Classify it by the worker's reason and exit code (full list):
Reason Look at Exited with code 1(or any 1–125)Your program: its log. Exited with code 127The command is not in the image. Check commandand the image'sPATH.OOMKilled: the container exceeded its memory limitMemory: the Memory chart near the limit. Raise memory_bytesorper_gpu.memory_bytes, or lower the batch size.ErrImagePull: …Image name and tag; for a private registry, the registry credential. Exceeded its time limit of 12hThe time limit: raise it, or checkpoint and resume. Machine lost: its lease expiredThe machine, not the run: see Machines troubleshooting. Restarted under its policy. Retry budget exhausted after 10/10 restartsIt failed 10 times in a row: the first failure's cause is in last_failure.Preempted by higher-priority work (…)Not a failure: it is queued again. -
Read the log of that worker (console Its log,
astra astraeus logs <worker>). For a worker that restarted, the last failure's 50 lines are in its failure panel orlast_failure.log_tail. - For a distributed run, find the first failure. One worker failing makes the others fail too (NCCL errors, timeouts). The run's reason names the first worker that failed for good; its log has the cause, the others' logs only the consequence.
- Check the metrics around the failure: memory climbing to the limit, a GPU at 0% (a hang), network traffic stopping.
- Check the history for what happened before: restarts, preemptions, a gang restart.
- Fix and start again: Run again on the run's page opens its specification as JSON under a new name.
Debug a run that does not start#
| It is | Look at |
|---|---|
Pending with No machine fits, Gang cannot be placed whole |
The per-machine reasons: Read a pending reason. |
Pending with Queued behind …, Next to run …, Waits for namespace quota: … |
The queue, not the machines: Priorities. |
Pending with Cannot plan workers: … |
The GPU count does not split as asked: change machines or the count. |
Preparing with waiting for external secret … |
The credential has not reached the machine: open the credential to see whether the machine could fetch it. |
Preparing with Waiting for data volume … or Waiting for drive … to be filled … |
The drive: open it to see whether it is reachable or still copying. |
Pulling for a long time |
A large image on a slow link. Later runs on that machine reuse it. |
Starting (a gang) for a long time |
One member is still preparing or pulling; after 15 minutes at the barrier the gang is requeued. |
| A worker restarting in a loop | The console's Restarting in a loop panel: restarts, when the next attempt is, and the last failure's output. Each failure doubles the wait, up to 5 minutes; after 10 restarts in a row it gives up; 10 minutes running resets the count. |